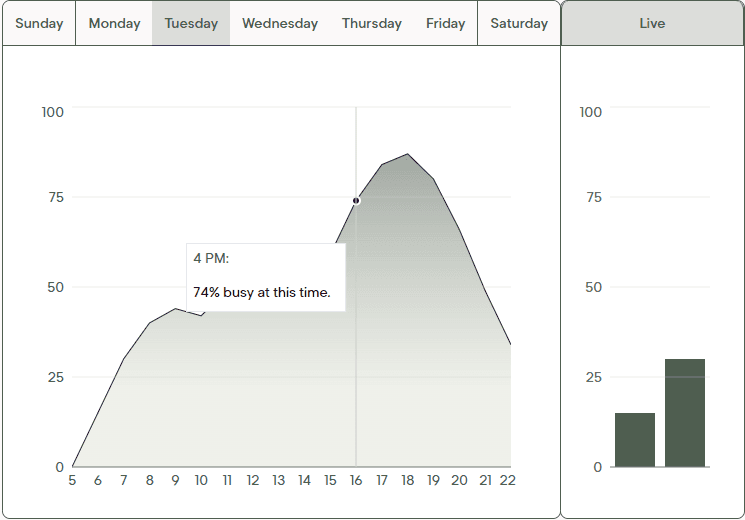
Crowdsurf.nu was a full stack project that aimed to provide information about how busy places are to people. The website was tailored for fellow Northwestern students, providing information for places like the gym, popular hangout spots, and a bustling cafe.
The project's backend consisted of a REST API incorporating Selenium/LXML with Django to scrape busyness data, serving and caching the data in a MySQL database hosted on PlanetScale. The backend was hosted and secured with Docker and AWS Cloudfront on an Ubuntu AWS EC2 instance employing Gunicorn for process management. Unfortunately, PlanetScale has since axed their free tier, and the project's backend is no longer running.
The project served 350+ daily users with a Next.js/TailwindCSS application on Vercel, delivering fully interactive, intuitive data displays for campus hotspots.
You can still find the decapitated frontend here
React-swipe-to-show is a zero-styled swipeable component with gesture detection for web, allowing customization of trigger and revealed content with 1000+ downloads.
The component was originally created for a class project meant to mimic iOS device swiping for an app that tracked grocery items and their expiry dates, when I couldn't find any components that weren't tailored for very specific uses.
I ended up reutilizing the core swiping logic and heavily modifying to handle customized children and revealed content. The project's still ongoing(with teammates) so it won't make an appearance on this page, but check my LinkedIn for any updates!
You can try it out with the bars on the left (or below, if you're on mobile), try swiping left!
The NPM registry for the package is listed here
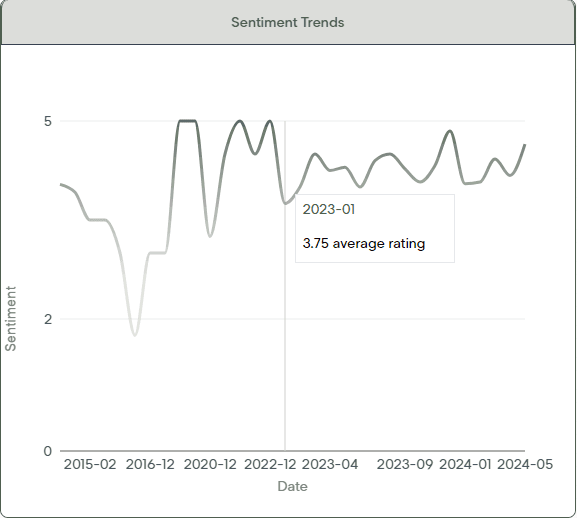
Streamlytics is a full stack web app that scrapes, processed, and displayed key information on demand for Paramount Global consultants about current show sentiments, reviews by review board, as well as trends for average public sentiment over time.
This app runs on the Firebase - Lambda - Vite stack, utilizing Firebase Cloud Functions as a replacement for a REST API. On demand, the app utilizes AWS Lambda to call Firebase Cloud Functions to scrape show review off popular review boards and conduct bayesian sentiment analysis using a cloud based LLM.
All results are stored in a Firebase DB, and can be retrieved at the click of a button much faster than its on demand counterpart with quick retrieval times to update graphs and dashboards.
The project also implemented an AI assistant to navigate the site and automatically set graph values from user prompts, calling AWS Lambda functions if necessary to collect new data.
The project is still in service, and the data shown here is real data! Many thanks to the team I worked with to develop this app!
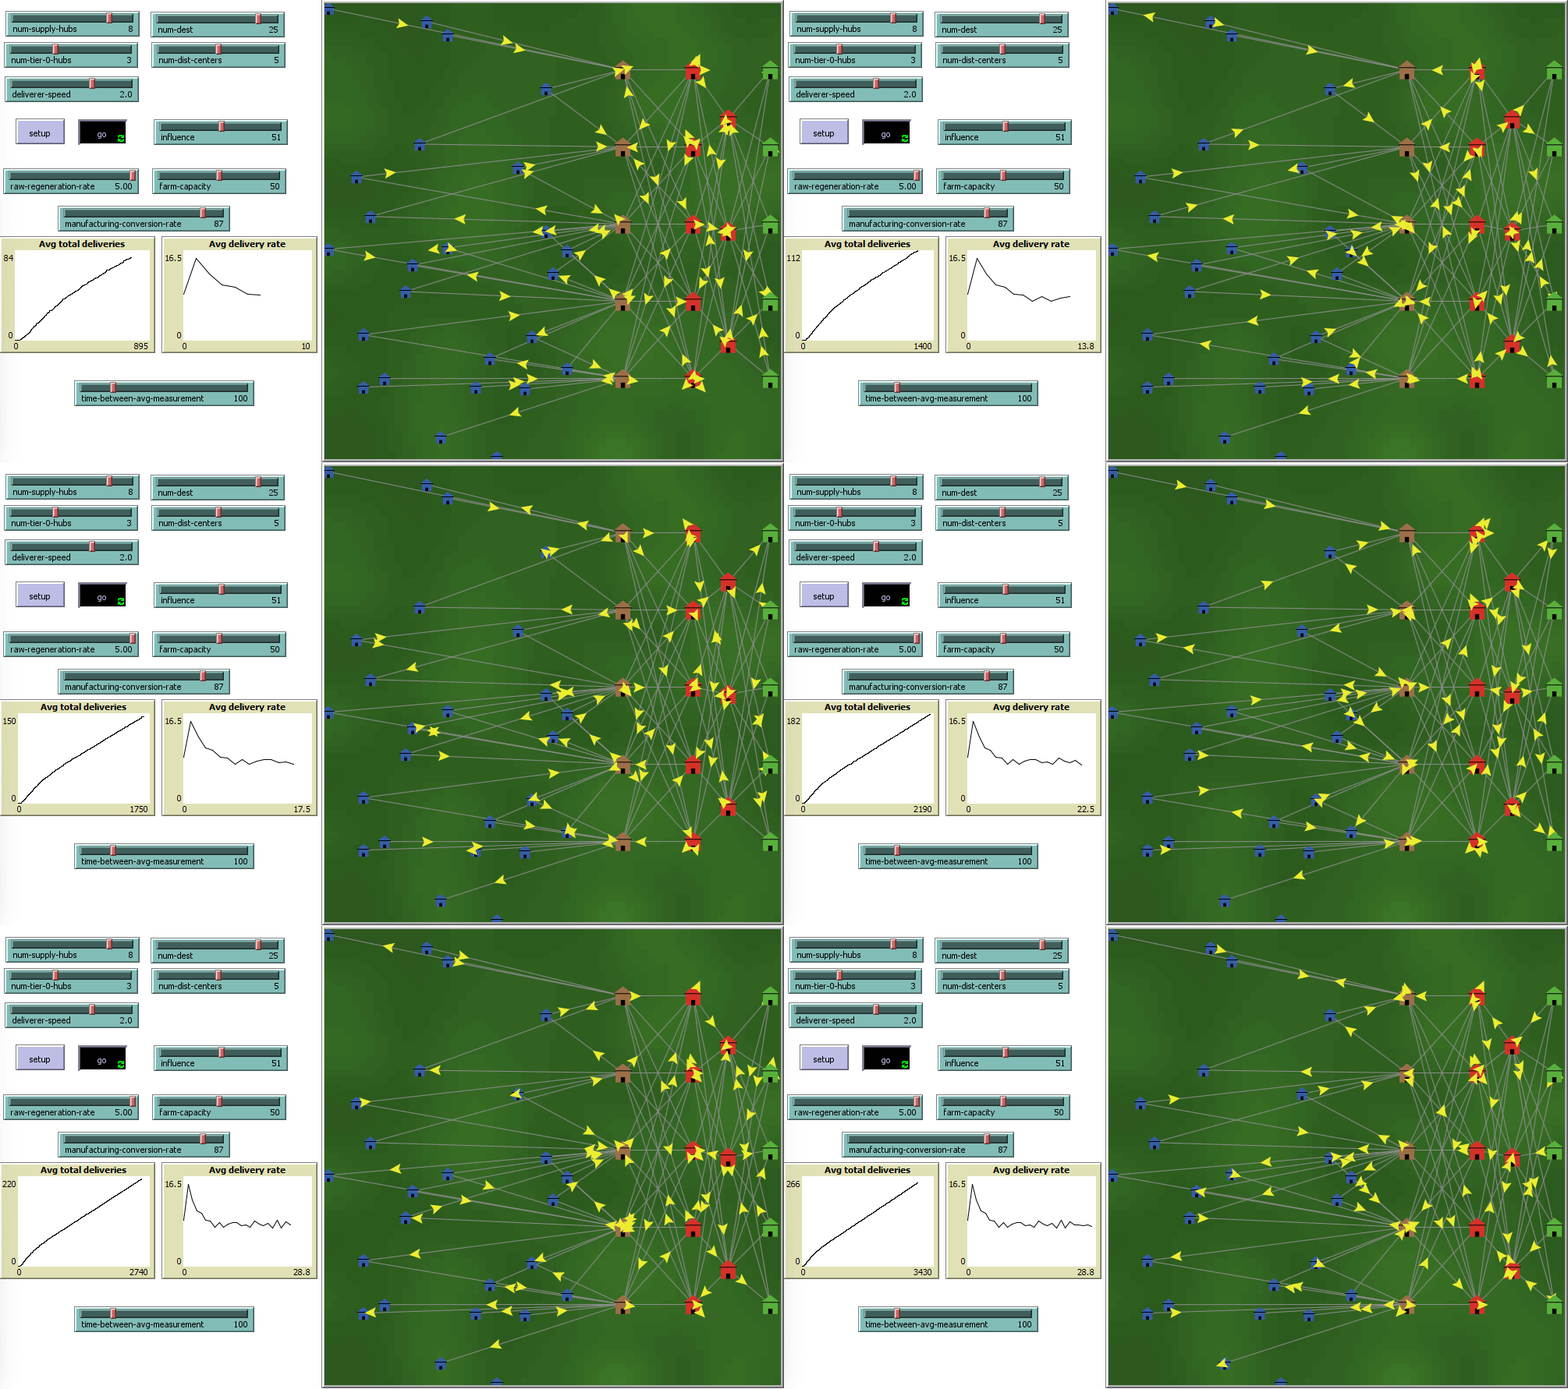
This project aims to measure how the number of network nodes, suppliers and distributors, can affect supply chain resiliency against external influences and stress. Darker green areas demarcate areas of higher environmental stress, and vice versa.
The project uses Agent-Based-Modeling(ABM) Software called NetLogo to reconstruct a simple supply chain model consisting of two tiers of suppliers (red buildings), and one tier each of raw material providers and distributors.
Delivery agents, known as turtles in NLOGO carry payloads across deterministically created links between each tier from the right to the left, ending in final destinations, the blue buildings.
In collaboration with Prof. Uri Wilensky and Prof. Michael Watson, you can find my poster and thesis!
Principal Component Analysis was used to cull 450 possible supply chain configurations down to 50. Each configuration was then tested 30 times for every stress value from 0 to 100 in increments of 5, giving 630 measurements for each configuration.
Data gathered for each possible configuration was the steady state average delivery rate, or the average delivery rate for 5000 ticks, the heuristically determined time length for the delivery rate to stabilize. Averaging 30 average delivery rates gives the averaged delivery rate for a configuration at a given stress level. We can then plot these 21 values to construct a influence vs averaged delivery rate graph for each configuration.
• Unweighted Resilience Metric:
• Weighted Resilience Metric:
• Continuous Frèchet Distance:
*The discrete formula was too long to render but it's the same general idea
For each graph, we can then gather 2 metrics, the unweighted and weighted resilience scores. Unweighted describes raw resiliency, while weighted resilience measures the raw resiliency while accounting for overall system performance. For comparing graphs directly, we use a 3rd metric, Frèchet Distance, which describes the 'distance' between two graphs. These are given by the above equations.
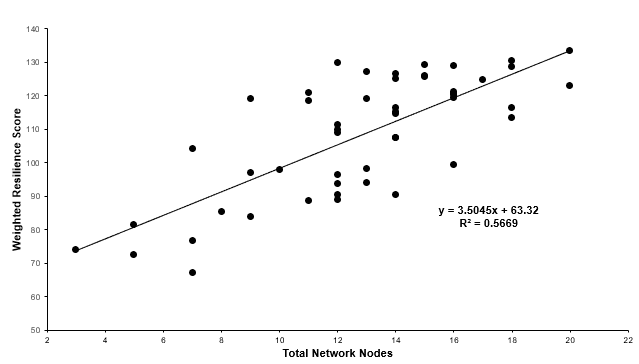
Interestingly, unweighted resilience plots shows no linear relationship between the total number of nodes in a supply chain model and its overall resiliency.
To use the interactive data displays, again, view on web!
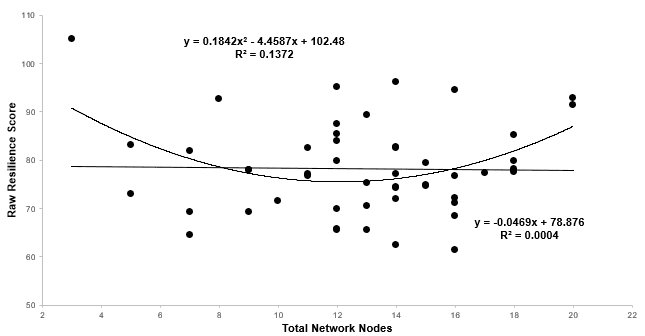
However, plotting the weighted resilience gives a more meaningful result with , suggesting a relationship between number of nodes and resilience weighted for performance.
My route optimizer project uses Kaggle datasets of doordash "drivers" and delivery locations and dropoffs as a baseline scenario from real data. The goal is to optimize the delivery routes to minimize total delivery time and maximize the delivery rates.
The project initially goes through several heuristically derived iterations that use naïve approaches to achieve a good result, such as assigning the nearest deliverer to the next order in the stack, but this is not optimal for obvious reasons, as any one deliverer cannot carry more than one order at a time.
The optimal solutions consist of two approaches. One summarizes the entire problem into a Mixed Integer Linear Programming (MILP) formulation. The other uses iterative route generation and evaluation via permutative, parallelized generation, and then conducts dual bound pruning with various APIs and hyperparameter tuning for each route to be used in the final delivery planning. A code snippet displaying the route evaluation code can be found on the left!
The Repo including all heuristic and optimized solutions can be found here.